CHART BREAKDOWNS

How to analyse a strong Forex chart breakdown

Use a top-down strategy for a thorough Forex chart breakdown, beginning with a monthly chart and plotting support and resistance levels, then moving down to acquire more detailed recent information on a currency pair.

While there are various trading methods and ways to break down a chart, we have discovered that starting with the higher timeframes is the best approach. When undertaking a top-down study, we normally start on a monthly chart. This enables us to search for overall momentum and larger trends that have developed over the last few months or years.

To begin, we plot two to three key levels at the immediate support and resistance levels. Make sure to round these levels to the nearest level or half-level and mark them as monthly support or resistance, depending on where they are in relation to the current market price. This guarantees that the levels are psychologically attractive to the currency pair.

Most Forex traders will also put their stops at these round levels. You’ll have a precise trading aim in mind, knowing exactly where the levels are and how the market is moving.

Move to the weekly Forex chart

Then we go down to the weekly to acquire more up-to-date information on the currency pair’s performance. Even on a weekly basis, candlesticks have a lot of weight when it comes to predicting future results. Weekly candlesticks may carry a lot of momentum and move a currency pair a number of pips, so it’s crucial to look at the latest 5 to 20 candlesticks and see how they played out.

We can allocate up to two more key levels throughout this timeframe; be sure to round these levels to keep them clean, and identify them as weekly levels for future reference. This will help you distinguish the levels and comprehend their impact on the lesser timeframes as you step down the timeframes.

The more organized and tidy the chart is, the easier it will be to traverse, and you won’t have to undertake another thorough top-down analysis for weeks or months, depending on the quality of your analysis. As you gain more chart time and experience, you will notice that you are not rebuilding your analysis as frequently as you once were, owing to the market repeatedly using your key levels.

Step down to the daily Forex chart

We may then move down to the daily chart to see more detail about where a currency pair might be headed in the next one to four weeks.

On the daily chart, we can assign up to two more critical level zones, which will be labelled as daily. In order to trade within the overall direction of the chart, we should also search for Fibonacci movements within the trend and extension possibilities between the retracement and goal levels. Look for trendline bounces and breaks as well, as the daily can offer some excellent setups.

On the daily and weekly timeframes, you should be able to recognize the overall trend and set one or two strong targets, as these are the import destinations where we believe the market will end up. The most critical aspect of a currency trade is the destination; otherwise, you will have no idea or strategy for exiting positions.

Find setups on the 4-Hour Forex chart

Finally, we reach the 4-Hour Forex chart. Some traders might want to also utilise the 2-Hour Forex chart and 1-Hour chart. We recommend traders not to go below the 1-Hour timeframe as this can increase chances of profitability and not result in a charting mess.

We want to try to discover our entry point into the Forex market as we continue to analyse the 4-Hour Forex chart. Using more trendlines and breakout ideas, momentum should begin to build in regions where we can discover strong risk-to-reward trades that we can trade towards our overall targets found on higher timeframes.

You will also need to think about allocating a stop loss in a safe place where you believe your bias will change. If the Forex market does go against your bias and it reaches your stop loss, then the market will likely continue in that direction and your trade will be stopped out.

You may be exposed to contradicting information as you progress through the different timeframes, which can be confusing to a trader. Always consider the higher timeframe as more solid information because the movements will be more reliable than shorter-term chaotic swings. If you’re ever confused or need more clarity, go back to a longer time frame to gain a better image.

To get your head straight, you might want to delete some of the analysis tools. On the other hand, if you need require more information or a more precise structure, you should certainly reduce the period. Learning the best strategies for scaling timeframes takes time, and each Forex trader has their own method.

Share:

Share on facebook Share on whatsapp Share on twitter

BASIC CHART PATTERNS

Basic charting patterns explained

Using established chart patterns can help a Forex trader spot more opportunities within the market. Our experts explain how you can utilise chart patterns optimally.

Using established trading patterns can help a trader to spot more opportunities in the Forex market. However, spotting a single chart pattern on the daily chart isn’t a winning formula. It is about how we use chart patterns in combination with other tools to create more confluences which will inevitably give our setups more probability.

Employing chart patterns will be similar to using a bomb detector in that you will be able to locate moments on the chart before the explosion of movement. If you can correctly detect a breakout explosion, you’ll often be able to win handsomely in that trading spot.

As well as showing areas of fast movements approaching, chart patterns can offer indications of great trades around entry points. Let’s cover some of the basic, classic charting patterns.

While some chart patterns, such as triangle formations, are not included in this article, most other classic chart patterns will provide more complex signals for finding trades. You will quickly obtain a lot of chart experience if you understand the fundamental concepts and keep your chart clean of overcrowding indicators.

Keep in mind that many other Forex traders will be attempting to use these tools as well, so be on the lookout for market manipulation. Make sure you note your entry and exit levels before allowing the action to unfold.

Wedge patterns

The wedge pattern in technical analysis is made up of two trendlines. We can break the wedge pattern into two forms – a falling wedge and a rising wedge. They tend to operate in different trends.

The main characteristic of these chart patterns is that they pull price action together like a spring, and the market prepares to release the spring, resulting in a decent breakout movement.

Rising wedge

Within two trendlines, a rising wedge is formed during a period of consolidation in an uptrend. It is frequently associated with price action that is steep. The lows are frequently printed faster than the highs, resulting in a wedge shape pattern. They can appear at any point during the course of a trend.

Price will frequently break out to the upside at the start of a trend, and it may also break out to the downside at the end of a trend. To create a target using the rising wedge, measure the base height and add it to the breakout to get the target level, which we can then trade toward.

Because these patterns aren’t as straightforward to draw on the chart, you’ll need to be inventive when employing them. When you’re in a profitable trade, lock in profits as soon as possible to help this charting pattern become even more profitable.

Falling wedge

The falling wedge, like the rising wedge, provides trading possibilities in the opposite direction. They can be discovered in a downtrend with price action that is dense. To create a target using a falling wedge, measure the base height and add it to the breakout height to get the target level, which we can then trade towards.

Rectangle break out patterns

Rectangle breakouts appear to be more common, and they’re the most popular method to view a breakout from a key level. On their charts, a competent trader will draw rectangles to represent support, resistance, or targets. We can search for momentum breakouts to carry our trades to the next target level when the price fluctuates between these levels and revisits them often.

These chart patterns are simple to draw and provide consistent movement as long as you trade with momentum and within a trend. To determine this, look to the left for a succession of higher highs or lower lows. You will come across manipulation that can lead to false breakouts from time to time, but understanding the overall sentiment and keeping to your original bias will help.

Head and shoulders pattern

Because it entails a trend change, the head and shoulders pattern is less prevalent. Because finding one at the end of a downturn would be deemed an upside-down head and shoulders pattern, it is most often during uptrends or at the end of uptrends.

As shown in the video above, the peaks will determine the formation. We need to see a left peak (left shoulder), followed by a higher peak or higher high (head), followed by a lower peak or lower high (right shoulder), and then a break and closure below the base neckline. Once we get this classic formation we can then look to short or sell that currency pair.

Depending on the preceding price action and what levels of support it lines up with, the target is then measured from the head or right shoulder. Some traders may wish to keep the trade open for a longer period of time because the trend on a higher timeframe has recently changed and there is much more potential. We recommend closing all, or at least a large portion, of the profit at the target as we don’t want to be too greedy or become overconfident when trading this chart pattern.

The head and shoulders pattern can appear on a variety of timeframes, from monthly to daily. While you might be able to locate one on a smaller timeframe, we’ve found that it’s not as reliable, therefore we recommend sticking to the daily or weekly timeframes to uncover these types of trend reversal patterns.


Share:

Share on facebook Share on whatsapp Share on twitter

LEVERAGE TRAPS IN FOREX

Leverage traps in Forex

High leverage and a lack of risk management discipline are the two main killers for rookie Forex traders. If effective risk management is not implemented, this might result in significant losses.

In Forex, leverage is comparable to margins, but not identical. The number of times you can leverage your entire quantity of capital is referred to as leverage. The maximum trading leverage will then be determined by the margin requirement.

Almost every new trader will fall for the leverage trap when they enter the Forex market. They see a 1:500 account with a minimum £50 deposit and think they can use their account repeatedly because that’s what the data on their compound Excel spreadsheet indicates.

If you don’t have much experience in the Forex market, even starting with a few thousand dollars can be a bad choice. If you are a novice trader, we recommend that you begin with a demo account to gain a better understanding of how the market operates before plunging in with both feet.


Don’t be fooled by manipulated scenarios

It’s common knowledge that most brokers will manipulate situations for a profit. With 90%+ of Forex traders losing, the broker can offer accounts that build upon their success and not the success of traders. They do this by controlling the spreads, leverage, and other factors that can be adjusted in trading scenarios.

Set trading guidelines for yourself before deciding which trading account to open, and stick to them with a low-risk strategy that focuses on long-term growth. You may be thrilled about increasing your competence and winning over a wide sample of trades without having any short-term emotion linked, but you must set realistic expectations for yourself and choose a reasonable leverage option.

Leverage and margin

If you are unfamiliar with margin in trading, check out our recent blog covering the basics. Leverage is essentially managing or trading a large amount of capital using a much smaller amount. The remainder is then borrowed to control more capital.

If you have £1,000 in a trading account with 1:100 leverage, then you will control £100,000 with £1,000. If the leverage was 1:1, you would control £1,000. Now it may seem like you should apply as much leverage to your account as possible, but placing a large position on a £1,000 with 1:100 is almost certain to end in a loss or blown account.

We have seen authorities step in over the years to bring down the maximum in certain regions and situations. We have also seen brokers offering 1:2000 leverage with a £10 deposit. While leverage is beneficial, too much of it, especially combined with poor risk management, may be disastrous.

How to use it?

As a beginning trader, using lower leverage is a terrific approach to get your feet wet and increase your account. As previously stated, there are numerous drawbacks to trading with high leverage. It will eventually enable you to increase the size of both your successful and lost transactions. But keeping a controlled 1:5 to 1:30 leverage is ideal for growing any amount of capital over a long and sustained period.

As mentioned in previous blog posts, we need to stay away from margin calls. We do this by making sure our risk management is perfected and we allow ourselves to survive any losing streaks to hopefully come out on top.


Consider the correct amount of leverage

When opening a Forex account, you should decide on the appropriate level of leverage after considering the associated fees. When you utilize large quantities of money, transaction fees can rise, but you also want to leave room for rewards.

The higher the leverage, the higher the commissions and swaps on your trades. It is possible that transaction costs can hinder your success if your leverage is too high, not to mention destroying your ability to trade much large lot sizes.


Survival with a decent trading plan

With a sound trading plan and a modest leverage account, you can survive, but as you get more charting experience and a better understanding of the markets, it’s a good idea to gradually increase the leverage while still adhering to good risk-management principles.

All these factors depend on the trader’s style and situation. For example, if a trader places mostly swing positions with a high pip stop loss, then an increase is not necessary. But for day traders who operate with 15-50 pip stop losses, leverage will be used more naturally. So many factors are used to determine the correct amount of leverage.

Conclusion

The moral of the story is that leverage should never be underestimated. Make use of it to increase your capital and your success. It’s a powerful instrument that can either help or hurt traders. Never trade with a short-term attitude and always strive to improve your skill set. With low leverage, you can trade safely and protect your capital. Be honest with yourself about your goals and treat the market with respect.

Share:

Share on facebook Share on whatsapp Share on twitter

UNDERSTANDING DXY

Understanding DXY

Understanding the Dollar Index (DXY) is a fundamental requirement for all Forex traders.

The DXY is the USD Dollar Index that controls the value of the US Dollar (USD). If you have ever traded Forex, you have most likely traded a currency pair with the US Dollar included. Any currency pairs that contain the USD are known as major currency pairs. Any currency without the USD involved is a cross-currency pair.

The DXY base price is 100.00, which is relative to the percentage of price gain or loss. If the value is 97.00, this means a 3% decrease in value has occurred since the beginning of the index on that chart. There are many uses for the information gained from DXY movements. It’s an accurate reflection of the dollar price and how it compares to other currencies.

This information can also be used for other business objectives by goods and commerce. Any investor or interested party can examine the impact of economic conditions on the dollar in order to plan future financial moves. This information will also be used to convert currencies for travel and tourism.

How do you manage USD?

Breaking down conventional Forex charts on a technical level is similar to reading the US Dollar. However, when it comes to fundamentals and price movements, analyzing the US Dollar necessitates a deeper understanding. The fact that you have a bias for DXY will persuade you to think about the influence it will have on other instruments.

For example, if the Dollar Index goes up the EUR/USD chart will go down. That’s because the USD strength will pull the price down within the currency pair. On the other hand, if we look at USD/CAD, both the DXY and USD/CAD will move in a similar direction 100% of the time. So, managing biases and receiving conflicting information can easily send traders in circles. It’s, therefore, best to manage each asset on its own.

Keeping the Dollar Index in your watchlist is a good idea, even when considering your other pairs. Track it over time and plot on simple key levels on the higher timeframes such as daily, weekly and monthly. The Forex market should keep revisiting your key levels and analysis can provide that extra edge for your market judgement.

How do you trade DXY movements?

Let’s look at how we can use the DXY as a tool to find profitable trading setups. When analysing your watchlist of currency pairs, knowing where the DXY is on the chart and its overall sentiment can help with finding clarity for the other Forex pairs. You can then identify scenarios in which they correlate with your bias or viewpoint on the US Dollars forecast.

The news and fundamentals will have a large influence on the DXY. The global trade will also reflect in the value of US cross-rates across the world. So, when it comes to following the US economy and its impact on the Forex market, you can go as in-depth as you like. Jobs data or inflation numbers originating from the US government will provide the majority of the news that causes volatility.

Highly volatile market

Many traders may be enticed to participate in trading during live speeches by the Fed and the US president throughout the year in order to make a quick buck. More money is rushed into the market during major occasions, creating more manipulation by larger investors and rendering the market more volatile.

That’s why we recommend that our Forex traders not trade during heavy news announcements that could affect their open trades. Sometimes, the price is pushed so hard in both directions that stops are triggered.

Moving the US Dollar

While some positive US news may appear as if it will increase the value of the dollar, you need to interpret how the data will affect world trade or other business interests. We can view currency circulation, volume, and other factors that will move the value of the dollar. 

If you forecast dollar weakness in alignment with the fundamentals, then it might be worth looking to see if the EUR/USD chart has enough bullish confluences to enter into a long/buy position to take advantage of the forecasted dollar move.

It is also possible to trade indices such as the US30 where you can also take advantage of US economics. Spreads and trade conditions are similar to trading commodities – something to keep in mind. As of late, some traders have been able to profit lucratively from the US indices. 


DXY Conclusion

Gathering evidence on the US Dollar’s movements can put you steps ahead of other Forex traders. Knowing the key levels and volume times will enable you to effectively manage trades relative to the daily news.

If you do have any major currency pairs on your watchlist, it is also crucial to review the DXY chart before and during a trade to make sure you are taking into account the full story. If you haven’t yet looked at the DXY, search ‘DXY’ on Trading View, and back-test your technical breakdown strategies to understand its movements.


Share:

Share on facebook Share on whatsapp Share on twitter

SETTING STOP LOSSES

Setting stop losses as your trading seatbelt

Stop losses are like seatbelts for Forex traders. They will help a Forex trader stay afloat and grow their capital.

A stop loss is a level at which the market will remove a trader from a position to prevent further loss. The main goal of a Forex trader is always to grow capital. We can cut losses short with the use of a stop loss order on all of our trades.

All Forex trading platforms will have the option of stop losses as part of the trade setup. Should the currency pair reverse, a trader will be able to precisely establish a stop loss at a level at which they must exit the deal.

Why use a stop loss?

There are two basic rules:

Rule 1: Always use a stop loss!

Rule 2: Never move a stop loss once it has been placed.

There is no set or standard way to place a stop loss. The stop loss required in any given situation will be determined by market conditions and the trader’s opinion of where the cut-off point should be.

Without a stop loss, a Forex trader’s account would suffer, and trading will cease to perform like a business. It’s a complete risk. We can avoid significant losses on trading accounts by implementing tactical stop losses.

Avoiding any emotional decisions

When sitting behind the charts all day, some Forex traders may say that they will personally close out the position. Setting a stop loss prevents our emotions from taking control, because we’ve previously decided where the trade should end if the Forex market moves against our trading bias.

As Forex traders, we don’t want to be a part of the group of traders who blow their accounts. We always want to be able to immediately reduce a loss and exit the Forex market before the loss grows too large.

Maintain discipline and let the stop loss alone after it has been set. It’s tempting to imagine that moving the stop loss into a higher loss will offer the transaction more room, but this will simply leave you open to significant losses in your trading account.

How to set a stop loss?

Physically setting stop losses can be easy, but knowing where to place them on the charts can be a more difficult task.

Managing stop losses while a trade is active is a good idea, especially if you want to bank some profits while reducing risk in certain trading scenarios. This can be done in your trading platform. 

Percentage of your account

In every trading scenario, you will want to set a stop loss based on a percentage of your account. This will allow you to predetermine the total risk allocated on that trade. If you are trading a standard account, this should be no more than 3%.

Some traders may control their risk by the number of pips or points on that stop loss. So, if they risk 0-40 pips = 1% risk. 40-100 pips 2%. And anything above up to 3%. By setting your stop losses in this way, this you will control the risk exposure and adapt for each situation.

Short trades will be quicker and more volatile. The larger pip trades, on the other hand, will take longer, so you’ll want to be paid for your winnings when they meet their targets.

Identifying the right places

Using indicators to identify key areas to place these stops could be a good strategy. Using average true range or Bolinger bands on smaller timeframes, for example, will give you a sense of structure. After that, you’ll need to set a stop above or below those levels, and if such levels are met, the bias will be invalidated.

Remember that when you use popular indicators and tools, they are accessible to every other retail trader, making them open to manipulation during certain hours.

Traders can make mistakes while establishing stops, such as placing them too close together with insufficient breathing room. If you don’t let the Forex market breathe or vary, it will almost certainly hit your stop loss.


Understanding volatility

It is a good idea to research and try to understand the currency pairs you trade and monitor their volatility when looking at the size of the stop loss to place. It is not possible to make 100 pips profit if you only gave the trade 5 pips stop loss. On the flip side, you also don’t want to place your stops too wide. 

The pip value is the ideal place to search for stop losses. After you’ve determined your pip stop loss and trade plan, you’ll want to consider risk and position size.

Finally, pick a broker or service provider that matches your trading style. You’ll have capital management principles that you define for yourself, so combine that with correct position sizes and you should be in good shape.

Setting a stop loss conclusion

It will be difficult to stay afloat in the world of not only trading but also investing without using stop-losses. They are the fundamentals that should be followed at all times when trading.

Examine your losses if you are a losing trader over a large sample size. In some cases, lowering them can help you become more profitable. Always be in control of your risk and know each trade plan before you execute the position.


Share:

IS THE MARKET RANGING OR TRENDING?

Is the Forex market ranging or trending?

Is the market ranging or is it trending? Make note of this major factor before you plan your trade.

The overall trend direction of the Forex market is the first thing to consider while looking for a trade. Consolidation will be present in most circumstances, but it is critical to grasp the daily and weekly trends. This Forex market sentiment will have an overriding effect on the market and open trades.

Trending market

Traders often agree that trending markets are the most straightforward to trade. A trending market carries momentum in one direction for a long time. While these trends can be highly profitable when Forex trading, the retracements and trend changes are very significant, so effective use of stop-loss placements is necessary. 

Uptrend

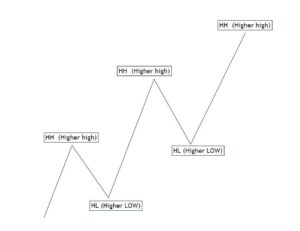
In an uptrend market, the currency pair will form a series of higher highs and higher lows. An uptrend can be confirmed with at least two printed higher highs. In this trend, we should only look for buys on the daily or weekly timeframes.


When analysing an up-trending market, look to trade within the overall direction of the Forex market momentum. We can seek out confluence such as trendline bounces or higher lows to form at Fibonacci retracement levels. These patterns will form buy zones, indicating that the currency pair will continue to rise and profit.

Downtrend

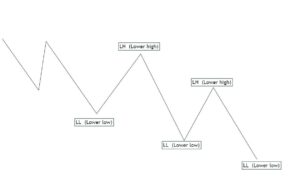
In a downtrend, the currency pair will create a series of lower lows and lower highs. This can be confirmed by at least two printed lower lows. In a downtrend, we want to look for short/sell trades most of the time.


Trend reversals

The shift in general momentum that causes a change in direction and pushes the price in a new direction is known as a “trend reversal.”

Range bound market

Range bound markets are the trickier Forex markets to trade within, as they can be erratic. These Forex markets will move sideways between two major key levels for a long period of time, and can often provide the most market manipulation. The price will not appear to be able to break through the support or resistance. It will just continue to move on a horizontal basis, confusing traders.


Some Forex traders will refer to this Forex market sentiment as “choppy conditions.” The range bound market will, frustratingly, not provide any long-term, clear direction. Yet, when a trader becomes frustrated, emotions can lead to negative results that are otherwise avoidable. 


In an ideal Forex market, we would want to take advantage of these conditions by buying at the lows and selling at the highs. Even in an ideal world, it can be difficult to build a winning trading strategy from basic trading analysis. Using trendlines can help with locating entry points and exit points. To locate these points, a trader would enter the market upon break-outs, then extract profit at the bounces on the trendline until point 1 is reached. 

Ranging and Trending Markets in the Forex Market – Conclusion

As important as it is to know the Forex market conditions and trends, it is also important to know when the market will retrace or reverse. By staying on your toes, you will be able to remain unbiased, enabling you to enter profitable break-out trades and more long-term positions. Expertise of the Forex market behaviour in different conditions will come with chart time and experience. 

Share:

Share on facebook Share on whatsapp Share on twitter

WHAT IS MARGIN

What is margin in Forex?

Margins in Forex trading are needed to open a position and keep it open. By applying margins, a Forex trader can effectively trade with more capital than actually in their account.

We can use leverage and trade Forex with the help of margins. To establish and sustain a trade, we simply need to invest a little amount of capital up front. An account margin is not a transaction cost like swaps or commission, but a portion of the funds set aside by a broker to open a trade and cover any losses that the trade incurs.


This capital is then used for that specific trade and cannot be allocated to other trades. In trading terms, margins are sometimes referred to as the “margin requirement.” This term is defined as: the percentage of the total position that you wish to open on the trade.


Margin requirements can be upwards of 1%, 5%, or 10%. The percentage will depend on the instrument you are trading, as well as your broker or provider. If you have a circumstance where the margin requirements are 3%, you will only need to put up 3% of the capital to open and maintain the trade.


If a Forex trader has multiple positions open, each trade will have an independent, required margin. The total of the open trade margins is known as the “used margin.” The used margin is the total of all required margin being used.

What is free margin?

The free margin is essentially the difference in value between the equity and total used margin. Thus, the free margin is the margin not tied up in the account. This statistic is usually shown live on your trading platform next to your account balance. As you open and maintain trades, the free margin will decrease and the remaining free margin will be displayed.


To calculate the free margin in a situation, we use the equation: Free margin = Equity – Used margin. The result will constantly change given the current margin situation. If multiple open trades are running in profit, the equity increases and more free margin will become available. This scenario would become more apparent with a higher leverage trading account.


If your trading positions are losing money, the equity will decrease alongside the free margin. If you have no open trades, the free margin will be the same value as your balance amount. The level of free margin versus the equity will depend on the buying power of the trading account. 

What is the margin call level?

Margin call or stop-outs are a Forex trader’s worst nightmare; the margin level has reached the upper threshold on the account. When this level is reached, the broker will forcefully close all positions and leave the small remaining capital. This process is known as “liquidating the position.”


Depending on your Forex broker, you will have a margin call of around 90%, with some brokers offering 100%. Ideally, you should never be anywhere near this level. If you are only risking a small percentage of your account value and you practice disciplined trading, you will never have to worry about the margin call.


If you do experience a stop out, take some time away from the Forex markets to refresh your mindset and revaluate your trading decisions. Focus on your missteps and rebuild your strategy more independently of your account margin. 

What is margin in Forex conclusion

While it may seem ideal to use high leverage and a high account margin to flip your account, regardless of your account type or leverage, it is important to maintain a low-risk strategy and not overextend your margin in Forex trading.. You can practice this by limiting the number of trades you place to one or two at any time. By limiting the amount of risk exposure on your account, you are also less likely to experience a margin call. 


Share:

ENGULFING CANDLESTICKS

Analysing engulfing candlesticks patterns: how it is done

Bullish engulfing candlesticks patterns are patterns of analysis that engulf prior candlesticks and change the price momentum.

Engulfing candlestick patterns can be either bearish or bullish. It is marked by a candle that closes higher or lower than the prior candles close. The body of the candle should completely overlap the prior candle’s body.

The more candles the candlestick pattern engulfs, the more impact it will usually carry. Ideally, you want to trade Forex currencies in the same direction as the engulfing candles, as they will carry overall momentum which may follow.

Understanding the engulfing candlestick pattern

Candlestick patterns are most common to trade on the daily chart. They will move in the direction of the overall Forex trend which should elucidate great points of entry.

As mentioned, you want to look for these candles on the daily and weekly timeframes to find substance. After identifying an engulfing pattern form on any lower timeframe, it can prove difficult to find a solid setup. Many days or weeks of low volume typically precede this pattern, especially over the news, and push the market in an overall direction.

Testing the engulfing candlestick pattern

You may find engulfing candles at the end of a trend to provide the currency pair with respite. For example, at the end of an uptrend, the price may quickly fall back into support engulfing prior candles and take out any stops of traders’ FOMO buying at the top.

We are not directing you to sell at the top of the candlestick, as momentum moves in large trends, and many Forex traders will fail if they try to ‘pick’ the very tops or bottoms of the trends. But, after the engulfing has invalidated the prior high or low, then the daily or weekly Forex trends can change.

You will want to study and back-test the engulfing candlestick pattern before jumping into the market, as knowing when to act on them can be tricky. Knowing whether it is a change in sentiment for the trading session might be difficult and can trap traders into the Forex market. The more conservative Forex traders may want to wait until the closure of the following day before trying to take advantage of any further movements.

Using the pattern in combination with other tools

The best way to get the most out of these candle formations is to use them in combination with other technical tools and confluences. If you are looking for a short position within a downtrend, and you see a daily bearish engulfing candlestick pattern at a lower high, then this will build confidence to trade that setup down.

Other ways to use the pattern is to combine key levels and look for momentum to occur after the engulfing has been printed. This is a good way to trade within the momentum, as long as it is in alignment with your bigger picture viewpoint.

When calculating risk to reward ratios, make sure you have wide enough stops to cover the bar to allow for pullback. If the market was to reach your stop, then it would certainly indicate that engulfing candlestick pattern was not respected, and you might need to rethink your overall bias and sentiment on that particular pair.

Engulfing candlestick pattern conclusion

Establishing trades from engulfing candlestick patterns isn’t always easy, but spotting them move within your bias can help with confidence in executing a trade. When price action is choppy, the market can move sideways within a range for a long period.

The engulfing candle patterns can help with identifying when breakouts will occur. Watch out for minor retracements, but expect momentum to follow through and price to continue developing in the indicated direction.

Share:

Share on facebook Share on whatsapp Share on twitter