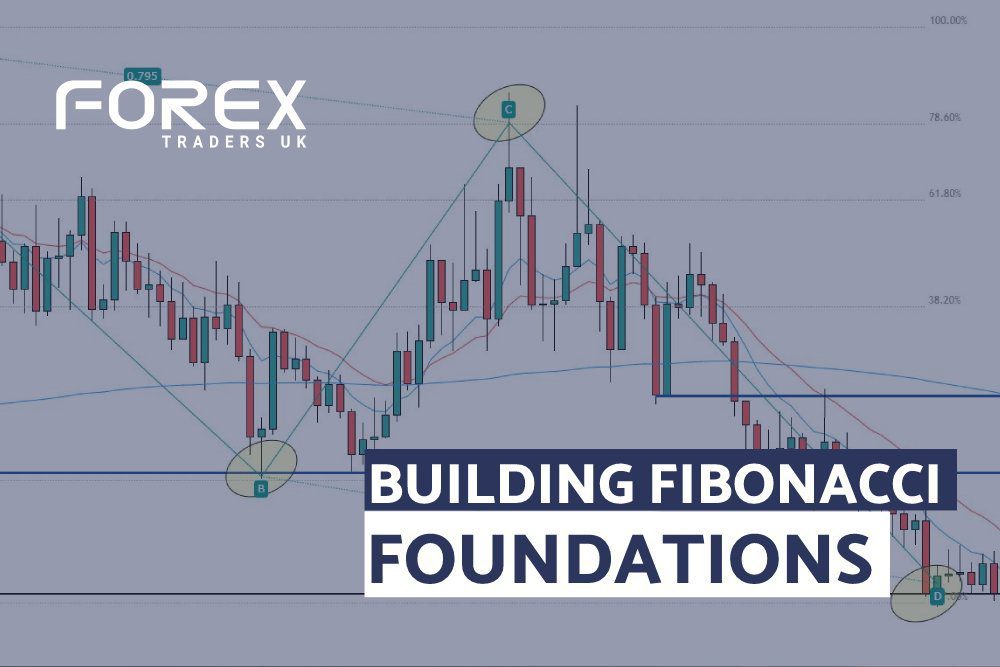
BUILDING FIBONACCI FOUNDATIONS

RELIABLE TRADE SETUPS USING THE FIBONACCI SEQUENCE

What is a Fibonacci sequence?

https://www.youtube.com/watch?v=kellUhpYJjc

Fibonacci was an Italian mathematician who defined a set of numbers. The Fibonacci sequence is a series of numbers in which, after 0 and 1, every number is the sum of the two previous numbers. The sequence produces sums into eternity:

0, 1, 1, 2, 3, 5, 8, 13, 21, 34, 55, 89, 144, 233, 377, 610, 987, 1597, 2584, 4181, 6765….

There are some fascinating connections between these numbers that form the basis of Fibonacci sequence trading. While we cannot cover all of these links in the present post, below are the most important qualities of the sequence that you will need to know when we apply Fibonacci’s principles to Forex trading:

  • If you divide a number in the sequence by the previous number, the quotient is approximately 1.618. This value is used as a key level in Fibonacci extensions as you will soon learn.
  • If you divide a number by the next highest number, the quotient is approximately 0.618. This number forms the foundation for the 61.8% Fibonacci retracement level.

The setup of the Fibonacci sequence
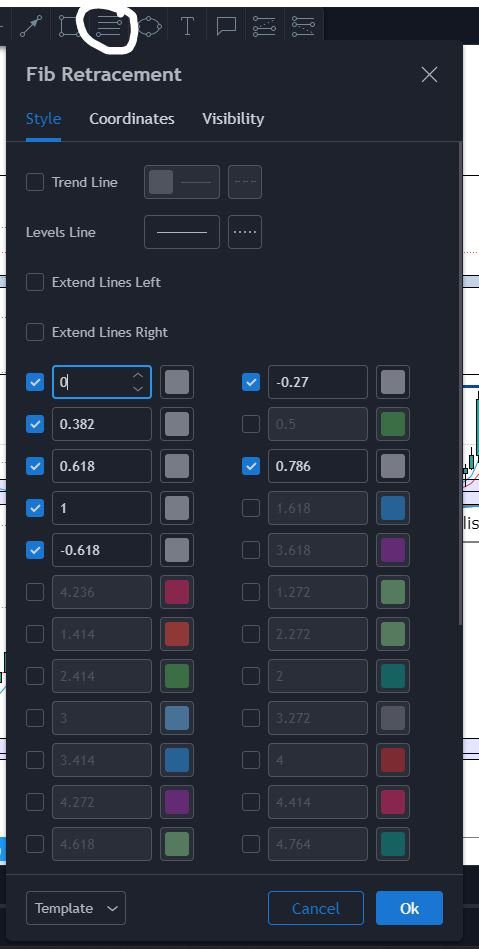
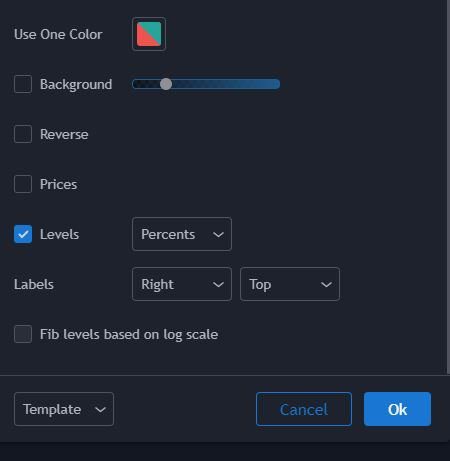
As pictured in the diagram above, these are the numbers we focus on when Fibonacci sequence trading. We use the 31.8% and the 61.8%/78.6% as retracements, and the -27% and -61.8% as the extension levels or targets.
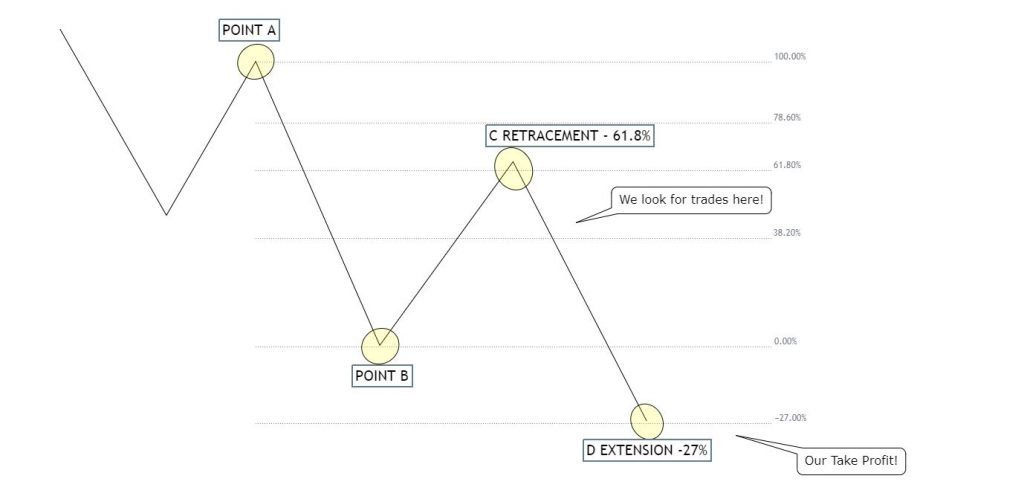
When to use the Fibonacci numbers

You should use the Fibonacci numbers when you have already identified the trend direction and key levels. Both Fibonacci retracement levels and Fibonacci extension levels are used by many traders with different trading styles and timeframes, such as long-term trading, intraday trading, and swing trading.

The tool and levels of the Fibonacci sequence are also used within many different trading markets, especially within Forex trading. The most effective time to use it, in our opinion, is when analysing the daily timeframe.

Use the Fibonacci sequence in both long-term bullish and bearish trends

The Fibonacci sequence is a basic tool. When combined with other Forex trading tools it is very powerful and accurate and can yield high profits. Combine Fibonacci strategy with:

  • Key levels
  • Moving averages
  • Trend direction
  • Trendlines

Conclusion Fibonacci sequence

Hopefully, you feel more comfortable with the basics of the Fibonacci sequence and how it can be applied to Forex trading. Remember, it will work on all timeframes, but it is better to utilise the strategy on the four-hour charts, daily charts, weekly charts, or monthly charts. Yet, this does not mean you cannot apply Fibonacci quarterly.

The Fibonacci sequence is a useful tool to identify where the targets, destinations, and pullbacks are likely to occur in a trend. As previously explained, 61.8% is a key number in the Fibonacci sequence, which is why it is commonly called the Golden Ratio.

Share:

Share on facebook Share on whatsapp Share on twitter

MANAGING OPEN TRADES

TRADING RISK MANAGEMENT WITH OPEN TRADES

Different trading and risk management strategies will lead to different outcomes

https://www.youtube.com/watch?v=jktfNxjeV4E

Not all Forex traders are the same; everyone’s performance is unique. The way that your methods can become more profitable is by understanding and respecting the best risk management strategies for trading. You should primarily focus on managing your trades in a way that minimizes losses and increases profitable trading outcomes.

Be flexible with your long-term trading risk management

You will experience many different challenges when managing your trades. While flexibility is essential, this does not mean you should completely change all of your strategies when faced with a new challenge. You should be adaptive and build upon what works for you. At the beginning, it may appear as if many strategies are not working at all. However, if you persist, you are bound to have a breakthrough and find a system that works for you when managing trades with minimal trading risk management.

Trade risk management with minimal risk

Your primary goal while managing your trading should be to minimize risk. Protect your trading capital while you allow for growth and maintain a healthy risk-reward ratio. There are many Forex trading strategies you can employ to build efficient risk management that will help you to achieve your long-term goals.

Essentially, these approaches will assist in reducing overall exposure to risk and minimise the likelihood of substantial losses as an outcome. Start by risking 1% over the next 4 weeks while implementing effective risk management strategies in your training and analyse the results of your performance.

When to close profits and losses

The simple answer to closing positions is, ultimately, when your bias changes. In most cases, you want to leave your trades to run, but there will be times when it is best to close out trades early, both when they are making profits and losses. You need to read and focus on the daily candlesticks to identify shifts, and then capitalise where you can. You must follow your risk management rules strictly in order to maximize profits.

Managing stop loss orders

Stop losses are not a trendy subject, but using them to restrain your trading like a seatbelt will only help you in the long run and promote optimal trading risk management. Knowing exactly where to set your stop loss initially can be tricky, but the level depends on your style and the situation. By utilising this tool, you can eliminate your losing trades as soon as possible and cut losses at the right time.

Usually, 15 to 20 pips above or below the prior high/low on the respected timeframe is sufficient long-term. Once your stop loss has been set, you should only adjust it to either break even or to profit. Never extend the amount of risk on one trade; always be firm with your stop losses. This strategy can be the key to optimal trading risk management.

Trading risk management overview

Overall, trading risk management is simple: you must earn the right to trade bigger. Managing the building blocks of your basic trading habits will allow you to grow capital in a way that will enable you to trade bigger down the road.

Be patient and enjoy the long road ahead without fear of loss. Stop losses can either aid in your profitability or capture profits. Using them will not guarantee success in trading, but without them, a trading career will be short-lived.

Share:

Share on facebook Share on whatsapp Share on twitter

RANGES AND ZONES

PROFIT FROM TRADING RANGES AND ZONES

Using trading ranges and zones helps us predict how a currency pair will behave, in order to profit from historical prices

https://www.youtube.com/watch?v=bfc7ZHwFOOg

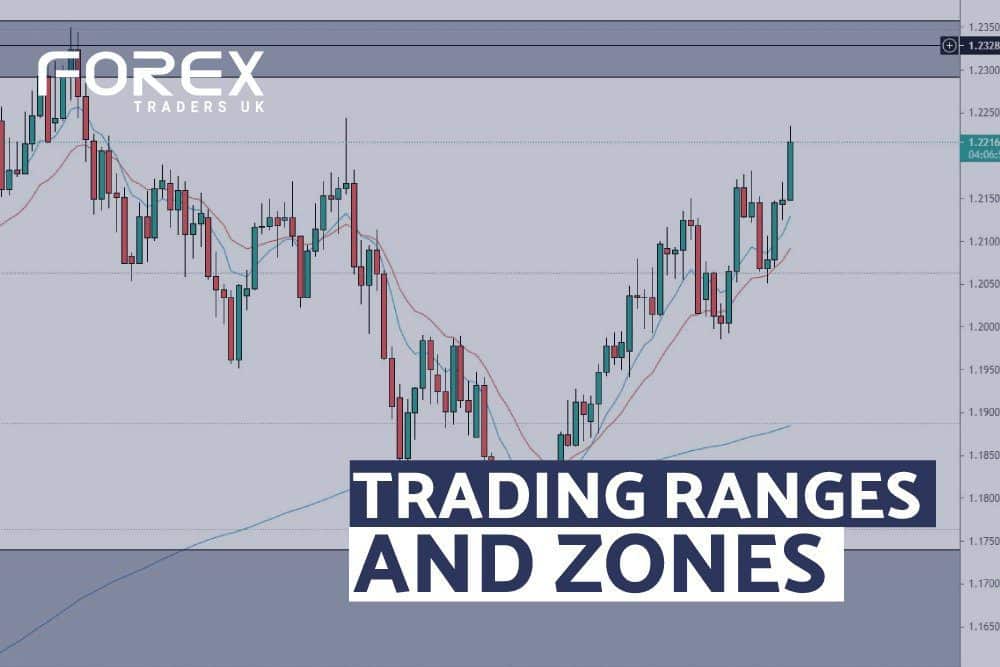
Trading ranges and zones are one of the basic forms of technical analysis, which essentially involves locating areas of support and resistance and using them to identify targets or trade entries.

Trading within rangebound markets or sideways markets is more challenging than trading within a strong trend as it can get quite complex. Using the key levels as support or resistance within a trend is much more favoured when it comes to long-term trading.

Using key levels as areas is far better than always using fixed price lines. We can use the more dynamic areas of trading zones to find better Forex trading opportunities.

Using a line of best fit

It is common for new Forex traders to experiment with support and resistance levels and where to plot them on the chart. You need to consider a few things when it comes to drawing on zones:

  • The number of wicks or touches in a certain area;
  • The time frame you are on;
  • Nearest round levels.

Once you understand the overall trend on the higher time frames, then you can plot the immediate daily support and resistance levels and use them on the lower time frames.

When support becomes resistance, and resistance becomes support

Resistance becoming support and vice versa is an action seen during the evolution of a trend and breakout points. This is due to key levels being broken and crossed by price. Once the new high or low is formed, a movement back to the broken key level will occur before a continuation in the trend direction. These are called retests.

Using key levels to set up a trade and manage risk

Trade setups will mainly use key levels to either place take-profit levels or stop-loss levels. Using them to manage risk will help cut losses short if a key level is broken in the opposite direction of your trade.

Psychological levels and round numbers

Psychological levels are price levels that are round numbers, like 1.2000 or 1.2500. Round numbers can frequently help you as support levels or resistance levels. Some currency pairs even carry the trait of magnetising to these levels when nearing them. When it comes to technical analysis, the higher the time frame, the more important the round numbers are.

Where we can find value with these psychological levels is when prices have resisted or been supported at these points in the past. This can tell us that those levels will carry more significance when being met. Many Forex traders will even use these levels as a stop-loss, so this is something to consider when trading to them.

Conclusion

Trading ranges and zones are important for building structure when you are Forex trading on multiple time frames. If a certain price has been met in the past, then it is likely to occur again. The quality of your support and resistance will form the base layer of good or bad technical analysis.

Forex Traders UK is passionate about educating traders about winning trading strategies. In addition to articles on technical analysis, we also write about technical mindset and other Forex-related topics. Subscribe to our newsletter to stay informed about our newest blog posts.

Share:

Share on facebook Share on whatsapp Share on twitter

MOVING AVERAGE TECHNIQUES

WHAT IS A MOVING AVERAGE?

Moving averages are one of the few indicators that are highly profitable when used alongside a robust structure of technical analysis

https://www.youtube.com/watch?v=ceYKnbo14pg

A moving average is one of the only indicators we use to support our technical analysis. It indicates the current market direction and trends with other benefits.

There are two different types of moving averages, depending on what data they collect and where they sit on the chart. We like to use the exponential moving average (EMA), although some traders opt for the simple moving average (SMA).

Moving average setup

The main setup for the moving averages that we employ is 9 (blue) and 18 (red), which can be used on all time frames and can be implemented as a trade confirmation. We also use the 200 daily moving average (DMA) and 200 weekly moving average (WMA) as a long-term confluence.

Purpose of Moving averages

Depending on how you use them, moving averages can offer both short- and long-term trade direction impulses with early signs of trend continuations and reversals. When rolling averages cross, it can suggest a trend change on that specific time frame. Managing support and resistance or to trade the crossovers is the main use of rolling averages. Some traders may only use one certain moving average, but using multiple allows the further confluence of these cross-over points.

Don’t use them as gospel

Whilst they can be a great tool in a trader’s toolkit, it’s important to use other forms of technical analysis before we place any trades based on moving averages. They should be part of the later tasks that involve breaking down charts as a final confluence to support a trade direction and confirmation on an already solid amount of information. Remember the markets on the higher time frames always leave many clues as to when prices will end up. Use the moving averages to spot the destinations of the currency pairs.

Dynamic support and resistance

As previously mentioned, rolling averages can also be used as dynamic support and resistance. Many moving averages carry more weight than others in the market, and using multiple can show the long-term dynamic areas we should be looking for trade entries at.

Ideally, on the daily and weekly, we want to use moving averages in this way and not on much lower time frames. However, using this indicator on the hourly for crossovers can serve as a great entry confluence for a trade. 

Conclusion

To conclude, moving averages are one of the most popular indicators as they are accessible on almost every platform. Make notes on them when recording your charts and look for correlations with what works for your trading style. As you gain experience with moving averages, you will see that they can be a very profitable tool.

But remember, these are indicators, and all indicators lag the current price, so use them only as final confluences. 

Forex Traders UK is passionate about educating traders about winning trading strategies. In addition to articles on technical analysis, we also write about technical mindset and other Forex-related topics. Subscribe to our newsletter to keep informed about our newest blog posts.


Share:

5 TIPS FOR TIME FRAMES IN FOREX

5 TIPS FOR TIMEFRAME ANALYSIS

Start at the higher time frame to trade Forex – Locate the larger trends, trade direction and trend analysis

https://www.youtube.com/watch?v=gNJZ_SslVEk&t=318s

After the trend has been determined on the monthly chart (lower highs and lower lows), you can look to trade in the direction of the weekly chart in a variety of ways. It’s great to utilize price action (as seen in our video) for determining trends and/or entering positions, but indicators can be utilized here as well.

As you go through and gain chart time and experience on your chosen time frames, it’s also important to understand the main time frames in Forex that most other traders will be viewing – for example, the daily chart or the hourly chart. These time frames can be the most manipulated in a way to throw traders off, so make sure to build a robust structure for identifying long-term trends.

Until the larger time frame analysis is mastered, beginner Forex traders should generally avoid trading on the lower time frames. As you get used to dealing with the increased market variability connected with the lower time frames, you can become more experienced in trading on the Forex market.

If you need clarity – take step back!

Most traders get lost in too many drawing tools to the point where they can’t see the candles. Remove some of the mess and step out to a higher time frame in Forex to regain chart clarity.

If you feel like you have enough information from a time frame, choose a shorter time frame

Once you are satisfied with your level of analysis on a certain time frame, drop down to get further detail. Ultimately, once you feel comfortable with the longer-term chart, you can then look to move slightly shorter in your approach and desired trade length times. This can inject more variability into your approach. It is important to carry out a plan and identify your perception of a trend before dropping down time frames.

Minimise the number of time frames in Forex

Aiming for three to five time frames will keep your trading at a level where it’s sustainable long term. This will allow you to understand the long-term perspectives without clouding your judgement.

As for the currency pairs you use for Forex trading, you may not need to view the monthly or weekly time frames in Forex every day because a stronger analysis is usually going to last several weeks. But, before each Forex trading session, have a set goal and plan for the time frames you intend to use to discover the information you need to make better trading decisions.

Do not go below the hourly chart

Staying above the 1-hour time frame will lead to more understanding and a better trading experience for your mental well-being. Whilst certain strategies and tactics work below this time frame, if any traders do venture below it, they will discover the mental strain and huge disadvantages that going below the hourly chart can cause in the short term. 

Conclusion

Be an all-around trader and repeat many similar trades over and over with low risk. Gather a large sample size of trades on similar time frames and iron out spots where they can be adjusted. Do not put yourself in a box, as many traders either jump on the side of ‘day traders’ or ‘swing traders’. Be both and stay on your toes. 

Forex Traders UK is passionate about educating traders about winning trading strategies. In addition to articles on technical analysis, we also write about technical mindset and other Forex-related topics. Subscribe to our newsletter to keep informed about our newest blog posts.

Share:

Share on facebook Share on whatsapp Share on twitter